PhiSpace ST for spatial transcriptomics
Cell types and niches in a Visium section of the mouse brain
Jiadong Mao
2026-10-13
Source:vignettes/PhiSpaceST.Rmd
PhiSpaceST.RmdIntroduction
PhiSpace ST applies PhiSpace to spatial transcriptomics (ST). A single-cell RNA-seq reference with annotated cell types is used to score every spatial location of the query for every cell type. The scores are continuous, so a location that contains several cells, such as a 10x Visium spot, can score highly for several cell types. The scores of all locations can then be clustered into niches: groups of locations with a similar cell type composition.
In this vignette the reference is single-cell RNA-seq of the mouse
somatosensory cortex and hippocampus (Zeisel et al., 2015), and the
query is a 10x Visium section of the mouse brain. The method is
described in Mao et al. (2026), Cell Reports Methods 6(8),
101483 (https://doi.org/10.1016/j.crmeth.2026.101483). The
introductory vignette,
vignette("PhiSpace", package = "PhiSpace"), explains the
PhiSpace scores in more detail. Larger case studies, including
imaging-based and sequencing-based ST platforms, are on the PhiSpace website.
Installation
if (!requireNamespace("BiocManager", quietly = TRUE))
    install.packages("BiocManager")
BiocManager::install("PhiSpace")
library(PhiSpace)
library(SpatialExperiment)
library(scRNAseq)
library(STexampleData)
Data
Query: a Visium section of the mouse brain
STexampleData
provides a 10x Visium section of the mouse brain as a
SpatialExperiment object. We keep the spots that cover
tissue, use gene symbols as row names, and log-normalise the counts.
query <- Visium_mouseCoronal()
query <- query[, query$in_tissue == 1]
rownames(query) <- rowData(query)$gene_name
query <- query[!duplicated(rownames(query)), ]
query <- logNormTransf(query)
query
#> class: SpatialExperiment
#> dim: 32245 2702
#> metadata(0):
#> assays(2): counts logcounts
#> rownames(32245): Xkr4 Gm1992 ... AC234645.1 AC149090.1
#> rowData names(3): gene_id gene_name feature_type
#> colnames(2702): AAACAAGTATCTCCCA-1 AAACAATCTACTAGCA-1 ...
#>   TTGTTTCCATACAACT-1 TTGTTTGTGTAAATTC-1
#> colData names(6): barcode_id sample_id ... array_col sizeFactor
#> reducedDimNames(0):
#> mainExpName: NULL
#> altExpNames(0):
#> spatialCoords names(2) : pxl_col_in_fullres pxl_row_in_fullres
#> imgData names(4): sample_id image_id data scaleFactor
Reference: single-cell RNA-seq of the mouse cortex and hippocampus
The Zeisel dataset in scRNAseq
contains 3,005 cells with seven major cell types in the column
level1class.
reference <- fetchDataset("zeisel-brain-2015", "2023-12-14")
reference <- logNormTransf(reference)
table(reference$level1class)
#>
#> astrocytes_ependymal    endothelial-mural         interneurons
#>                  224                  235                  290
#>            microglia     oligodendrocytes        pyramidal CA1
#>                   98                  820                  939
#>         pyramidal SS
#>                  399
The reference and the query are both RNA-seq counts, and both are log-normalised in the same way. We keep the genes measured in both.
Annotation
PhiSpace() fits a partial least squares (PLS) model of
the cell types on the reference and scores every spot of the query. The
number of components, ncomp, is set to the number of cell
types. With nfeat = 300, PhiSpace selects the 300 most
important genes for each cell type and uses the union of these genes in
the final model.
query <- PhiSpace(
    reference, query,
    phenotypes = "level1class", refAssay = "logcounts",
    ncomp = 7, nfeat = 300
)
reducedDim(query, "PhiSpace") <- normPhiScores(reducedDim(query, "PhiSpace"))
head(reducedDim(query, "PhiSpace"), 3)
#>                    interneurons pyramidal SS pyramidal CA1 oligodendrocytes
#> AAACAAGTATCTCCCA-1  0.004663063  0.409237551    0.05040388       -0.1054705
#> AAACAATCTACTAGCA-1  0.474867630 -0.009127846   -0.08759215       -0.1519571
#> AAACACCAATAACTGC-1  0.405585529 -0.318367654   -0.07267644        0.1684542
#>                      microglia endothelial-mural astrocytes_ependymal
#> AAACAAGTATCTCCCA-1 -0.05449354      -0.006142808           0.04007224
#> AAACAATCTACTAGCA-1  0.31060643       0.123793462           0.28495217
#> AAACACCAATAACTGC-1 -0.11648451       0.041157065           0.29934695
normPhiScores() centres the scores of each cell type at
their median and scales them to a maximum absolute value of 1, so that
the scores of different cell types are comparable.
Cell type maps
VizSpatial() colours the spots by the score of one cell
type. With censor = TRUE, scores below their median are set
to the median, so that the colour scale shows only the spots where a
cell type is enriched.
cellTypes <- c("pyramidal SS", "pyramidal CA1", "oligodendrocytes",
               "interneurons")
maps <- lapply(cellTypes, function(ct) {
    VizSpatial(query, reducedDim = ct, censor = TRUE, ptSize = 1,
               legend.position = "none") +
        ggplot2::scale_y_reverse() +
        ggplot2::coord_fixed() +
        ggplot2::ggtitle(ct)
})
ggpubr::ggarrange(plotlist = maps, ncol = 2, nrow = 2)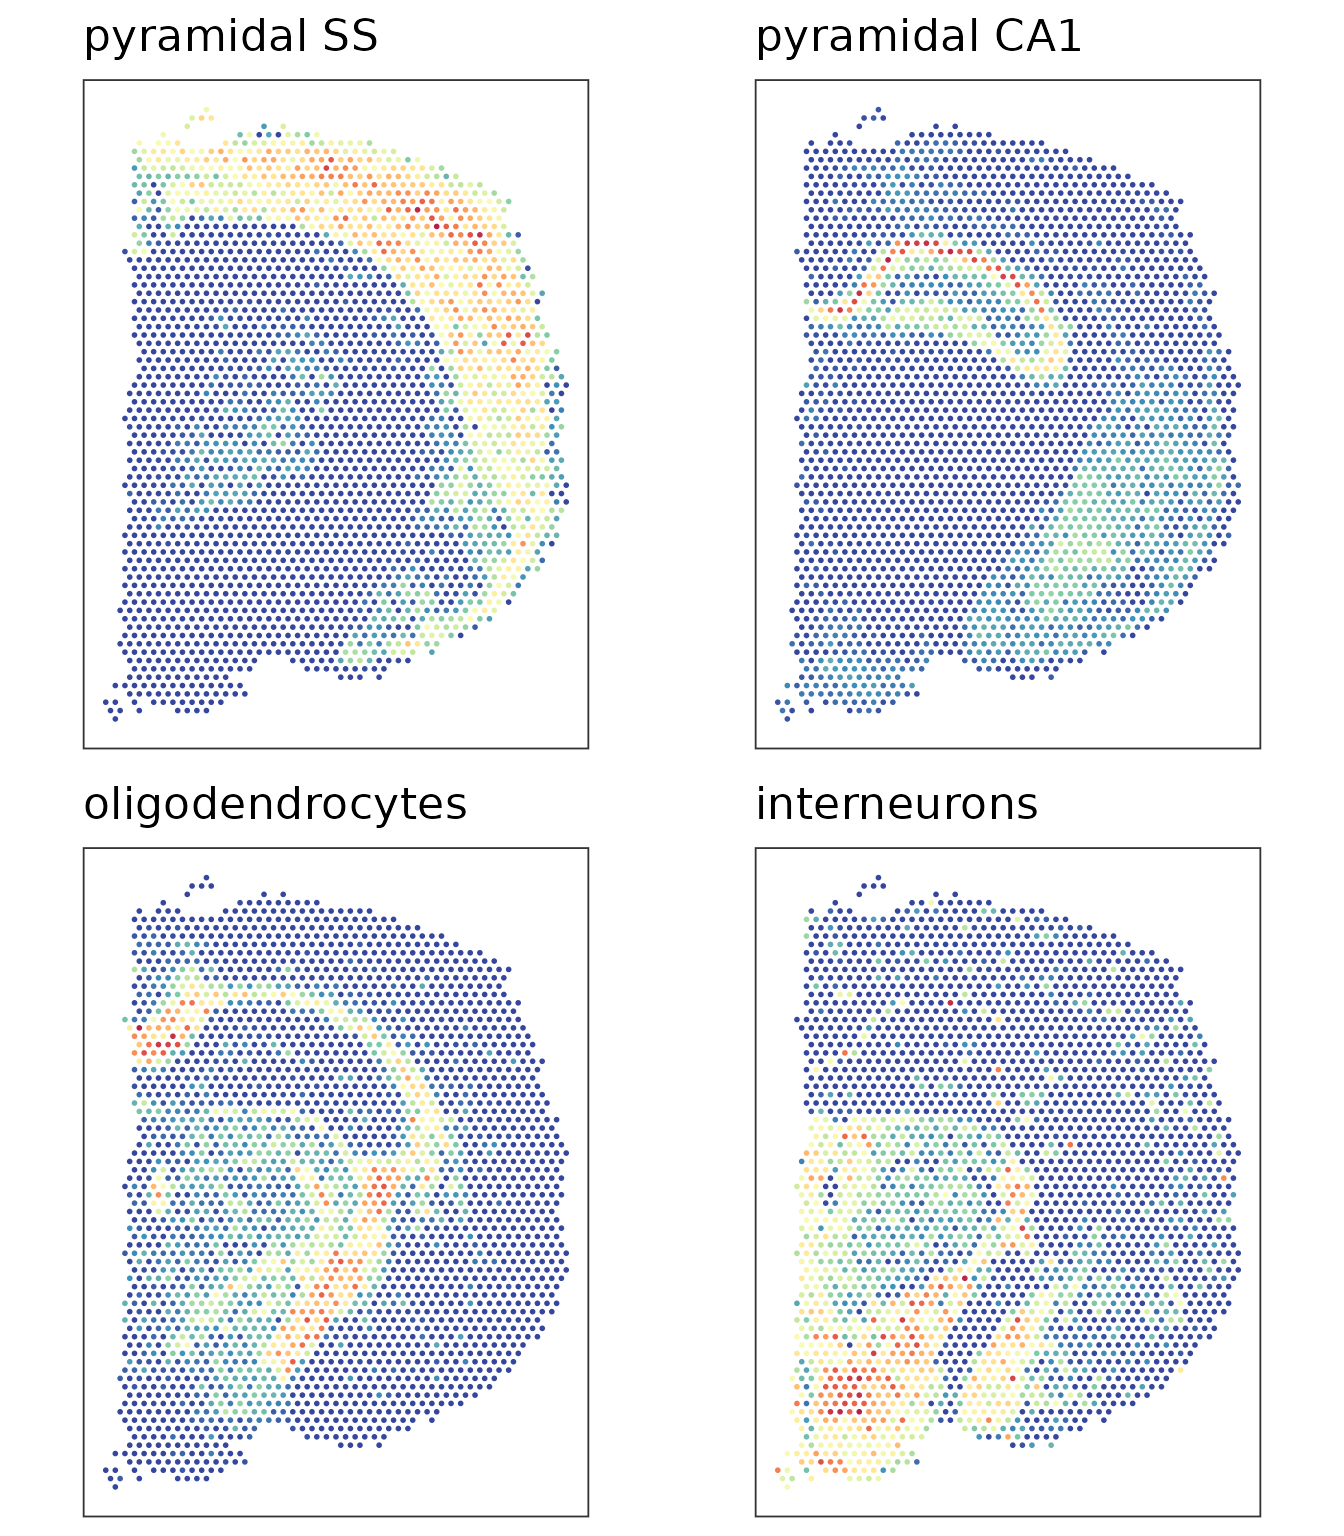
The pixel row coordinate increases downwards in the image, so we reverse the y axis to show the section in its usual orientation.
Pyramidal SS scores are highest in the cortex, along the top and right edges of the section, and pyramidal CA1 scores in a thin arc inside it, in the hippocampus. Oligodendrocyte scores are highest beneath the cortex and in deeper regions, consistent with white-matter tracts. The reference contains only cells of the cortex and hippocampus. Spots in other brain regions therefore score highest for the most similar reference cell types; here, many deep spots score highly for interneurons.
Niches
findNiches() clusters the spots by their PhiSpace scores
with k-means, after a principal component analysis of the scores. Its
seed argument makes the result reproducible without
changing the random-number state of the session.
query <- findNiches(query, n_niches = 6, verbose = FALSE)
table(query$spatial_niches)
#>
#> Niche_1 Niche_2 Niche_3 Niche_4 Niche_5 Niche_6
#>     261     264     544     389     692     552
VizSpatial(query, colBy = "spatial_niches", ptSize = 1.5,
           legend.title = "Niche") +
    ggplot2::scale_y_reverse() +
    ggplot2::coord_fixed()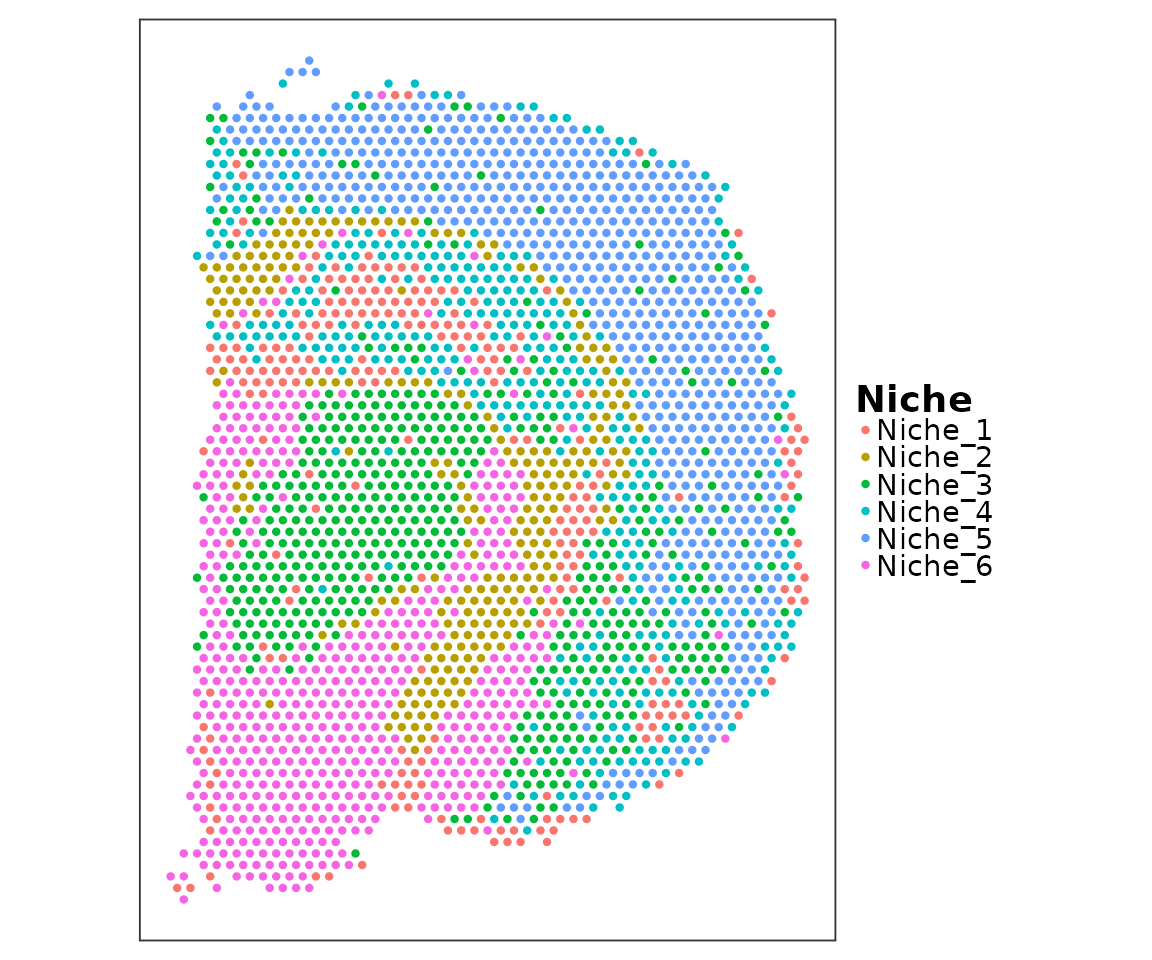
The heatmap shows the scores of all spots, grouped by niche, and so the cell type composition that defines each niche.
plotPhiSpaceHeatMap(
    reducedDim(query, "PhiSpace"),
    queryLabs = query$spatial_niches,
    cluster_columns = TRUE,
    name = "Score"
)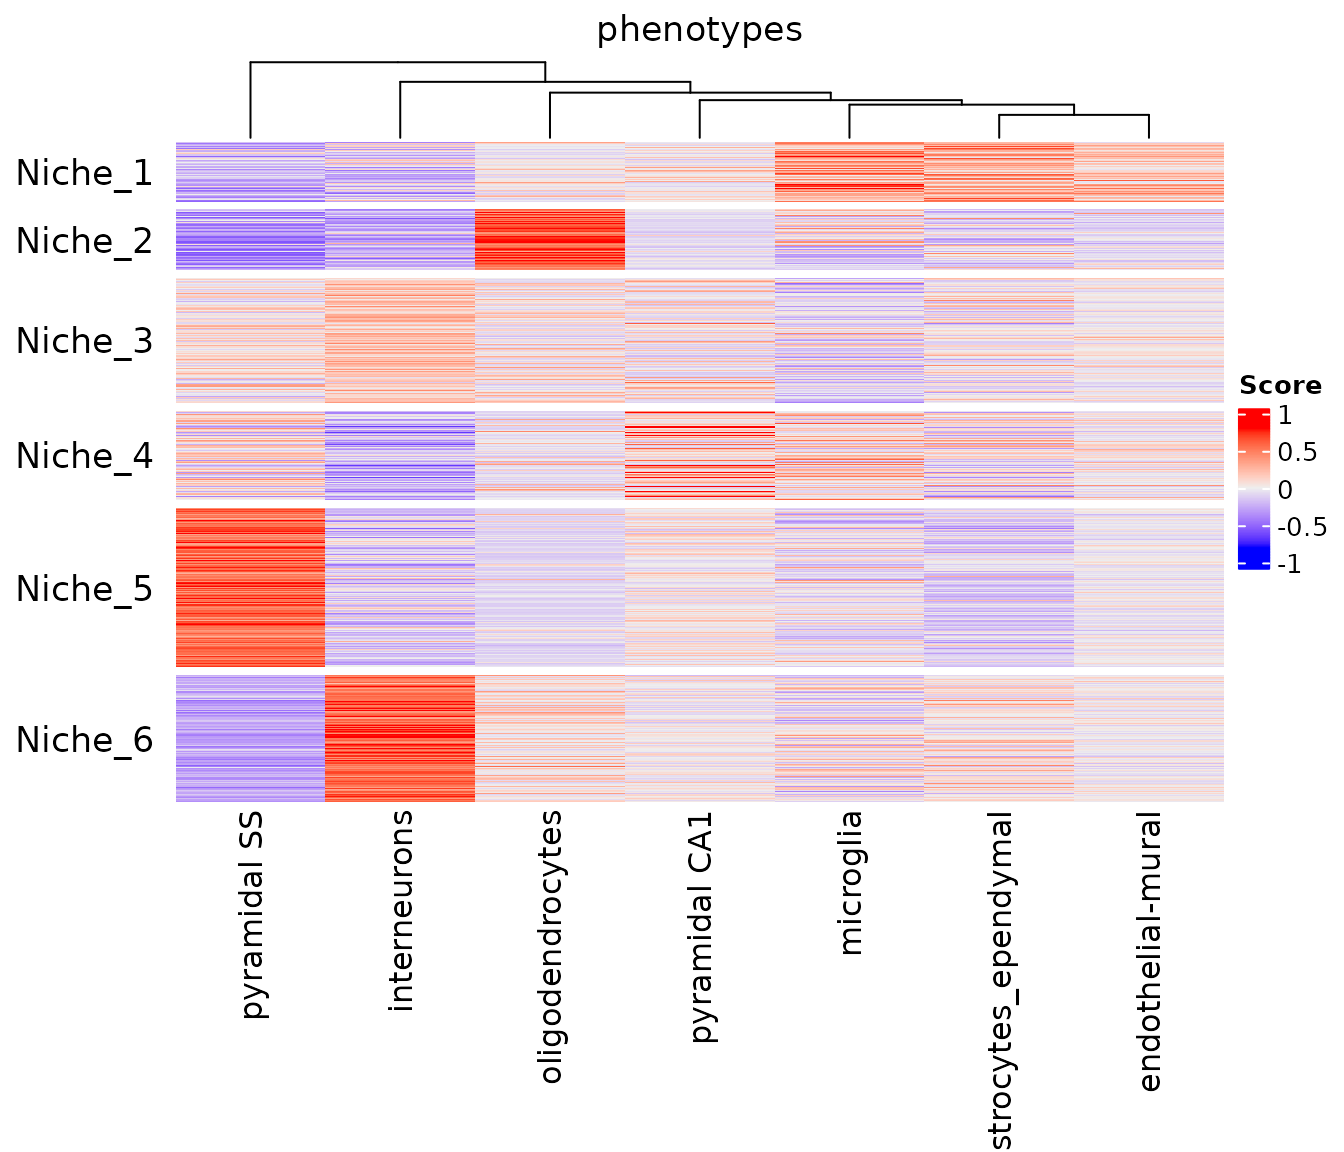
Most niches score highly for one or two cell types. For example, one niche scores highly for pyramidal SS and covers the cortex, and another scores highly for oligodendrocytes. The niche map and the cell type maps above show the same regions.
Session information
sessionInfo()
#> R version 4.5.0 (2025-04-11)
#> Platform: x86_64-pc-linux-gnu
#> Running under: Ubuntu 24.04.5 LTS
#>
#> Matrix products: default
#> BLAS:   /usr/lib/x86_64-linux-gnu/openblas-pthread/libblas.so.3
#> LAPACK: /usr/lib/x86_64-linux-gnu/openblas-pthread/libopenblasp-r0.3.26.so;  LAPACK version 3.12.0
#>
#> locale:
#>  [1] LC_CTYPE=C.UTF-8       LC_NUMERIC=C           LC_TIME=C.UTF-8
#>  [4] LC_COLLATE=C.UTF-8     LC_MONETARY=C.UTF-8    LC_MESSAGES=C.UTF-8
#>  [7] LC_PAPER=C.UTF-8       LC_NAME=C              LC_ADDRESS=C
#> [10] LC_TELEPHONE=C         LC_MEASUREMENT=C.UTF-8 LC_IDENTIFICATION=C
#>
#> time zone: UTC
#> tzcode source: system (glibc)
#>
#> attached base packages:
#> [1] stats4    stats     graphics  grDevices utils     datasets  methods
#> [8] base
#>
#> other attached packages:
#>  [1] STexampleData_1.18.0        ExperimentHub_3.0.0
#>  [3] AnnotationHub_4.0.0         BiocFileCache_3.0.0
#>  [5] dbplyr_2.6.0                scRNAseq_2.24.0
#>  [7] celldex_1.20.0              BiocStyle_2.38.0
#>  [9] PhiSpace_0.99.0             testthat_3.3.2
#> [11] SpatialExperiment_1.20.0    SingleCellExperiment_1.32.0
#> [13] SummarizedExperiment_1.40.0 Biobase_2.70.0
#> [15] GenomicRanges_1.62.1        Seqinfo_1.0.0
#> [17] IRanges_2.44.0              S4Vectors_0.48.1
#> [19] BiocGenerics_0.56.0         generics_0.1.4
#> [21] MatrixGenerics_1.22.0       matrixStats_1.5.0
#>
#> loaded via a namespace (and not attached):
#>   [1] BiocIO_1.20.0             bitops_1.1-0
#>   [3] filelock_1.0.3            tibble_3.3.1
#>   [5] XML_3.99-0.25             lifecycle_1.0.5
#>   [7] httr2_1.3.0               rstatix_1.1.0
#>   [9] edgeR_4.8.2               doParallel_1.0.17
#>  [11] rprojroot_2.1.1           ensembldb_2.34.0
#>  [13] lattice_0.22-6            alabaster.base_1.10.0
#>  [15] backports_1.5.1           magrittr_2.0.5
#>  [17] limma_3.66.0              sass_0.4.10
#>  [19] rmarkdown_2.32            jquerylib_0.1.4
#>  [21] yaml_2.3.12               metapod_1.18.0
#>  [23] otel_0.2.0                askpass_1.2.1
#>  [25] pkgbuild_1.4.8            reticulate_1.47.0
#>  [27] cowplot_1.2.0             DBI_1.3.0
#>  [29] RColorBrewer_1.1-3        abind_1.4-8
#>  [31] pkgload_1.5.3             purrr_1.2.2
#>  [33] downlit_0.4.5             AnnotationFilter_1.34.0
#>  [35] RCurl_1.98-1.20           rappdirs_0.3.4
#>  [37] circlize_0.4.18           irlba_2.4.1
#>  [39] alabaster.sce_1.10.0      umap_0.2.10.0
#>  [41] RSpectra_0.16-2           dqrng_0.4.1
#>  [43] pkgdown_2.2.0             DelayedMatrixStats_1.32.0
#>  [45] codetools_0.2-20          DelayedArray_0.36.1
#>  [47] scuttle_1.20.0            xml2_1.6.0
#>  [49] tidyselect_1.2.1          shape_1.4.6.1
#>  [51] UCSC.utils_1.6.1          farver_2.1.2
#>  [53] ScaledMatrix_1.18.0       GenomicAlignments_1.46.0
#>  [55] jsonlite_2.0.0            GetoptLong_1.1.1
#>  [57] BiocNeighbors_2.4.0       Formula_1.2-6
#>  [59] iterators_1.0.14          systemfonts_1.3.2
#>  [61] foreach_1.5.2             tools_4.5.0
#>  [63] ragg_1.5.2                Rcpp_1.1.2
#>  [65] glue_1.8.1                SparseArray_1.10.10
#>  [67] xfun_0.61                 GenomeInfoDb_1.46.2
#>  [69] dplyr_1.2.1               HDF5Array_1.38.0
#>  [71] gypsum_1.6.0              withr_3.0.3
#>  [73] BiocManager_1.30.27       fastmap_1.2.0
#>  [75] fansi_1.0.7               rhdf5filters_1.22.0
#>  [77] bluster_1.20.0            openssl_2.4.2
#>  [79] digest_0.6.39             rsvd_1.0.5
#>  [81] R6_2.6.1                  textshaping_1.0.5
#>  [83] colorspace_2.1-4          RSQLite_3.53.3
#>  [85] cigarillo_1.0.0           h5mread_1.2.1
#>  [87] tidyr_1.3.2               rtracklayer_1.70.1
#>  [89] FNN_1.1.4.1               httr_1.4.9
#>  [91] htmlwidgets_1.6.4         S4Arrays_1.10.1
#>  [93] org.Mm.eg.db_3.22.0       whisker_0.4.1
#>  [95] pkgconfig_2.0.3           gtable_0.3.6
#>  [97] blob_1.3.0                ComplexHeatmap_2.26.1
#>  [99] S7_0.2.2                  XVector_0.50.0
#> [101] brio_1.1.5                htmltools_0.5.9
#> [103] carData_3.0-6             bookdown_0.48
#> [105] ProtGenerics_1.42.0       clue_0.3-68
#> [107] scales_1.4.0              alabaster.matrix_1.10.0
#> [109] png_0.1-9                 scran_1.38.1
#> [111] knitr_1.52                rstudioapi_0.19.0
#> [113] rjson_0.2.23              curl_8.0.0
#> [115] cachem_1.1.0              rhdf5_2.54.1
#> [117] GlobalOptions_0.1.4       BiocVersion_3.22.0
#> [119] parallel_4.5.0            AnnotationDbi_1.72.0
#> [121] restfulr_0.0.17           desc_1.4.3
#> [123] pillar_1.11.1             grid_4.5.0
#> [125] alabaster.schemas_1.10.0  vctrs_0.7.3
#> [127] ggpubr_1.0.0              car_3.1-5
#> [129] BiocSingular_1.26.1       beachmat_2.26.0
#> [131] cluster_2.1.8.1           evaluate_1.0.5
#> [133] GenomicFeatures_1.62.0    magick_2.9.1
#> [135] Rsamtools_2.26.0          cli_3.6.6
#> [137] locfit_1.5-9.12           compiler_4.5.0
#> [139] rlang_1.3.0               crayon_1.5.3
#> [141] kerndwd_2.0.3             ggsignif_0.6.4
#> [143] labeling_0.4.3            plyr_1.8.9
#> [145] fs_2.1.0                  alabaster.se_1.10.0
#> [147] BiocParallel_1.44.0       Biostrings_2.78.0
#> [149] lazyeval_0.2.3            Matrix_1.7-3
#> [151] sparseMatrixStats_1.22.0  bit64_4.8.6
#> [153] ggplot2_4.0.3             Rhdf5lib_1.32.0
#> [155] KEGGREST_1.50.0           statmod_1.5.2
#> [157] alabaster.ranges_1.10.0   igraph_2.3.4
#> [159] broom_1.0.13              memoise_2.0.1
#> [161] bslib_0.12.0              bit_4.6.0